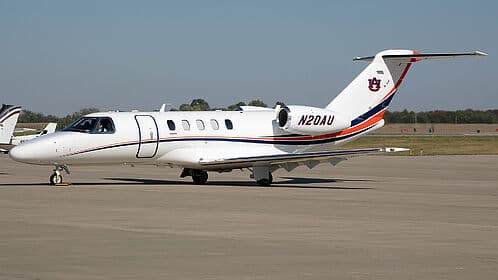
Auburn Tigers
Routes
Aircraft · 3


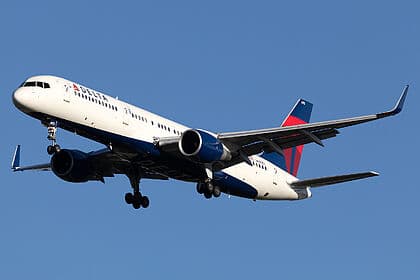
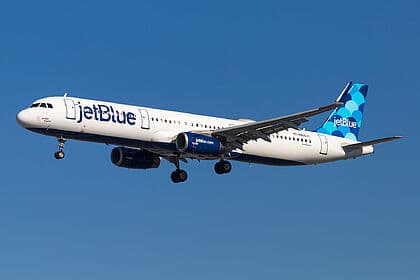
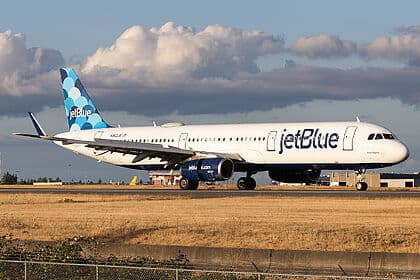
Flight activity
That's the last 7 days of Auburn Tigers flights. The full history is a Jump Seat · $15/month.
How the cost figures are estimated
Dollar figures on these rows are modeled from block hours and an effective-dated hourly rate, fit against an invoice corpus of 458 priced flight records worth $4.16M. A figure tagged Documented cost is a real invoice or billing record, not a model output. Booster-aircraft rows show an estimated value of the flight — gift-in-kind context, not program spending — and are excluded from the headline total. Some trips here are attributed through the current-owner directory rather than the aircraft's relationship on the flight date; treat those as provisional.
Rate version 2026-08-10.component-index-v1+type-utilization-v3. Full sources, the out-of-sample error measurement, and what these numbers do not claim: flight cost methodology.
Attribution methodology
Aircraft attribution does not identify passengers. Program-owned and verified privacy-alias aircraft show all tracked activity; other aircraft appear only when the trip is documented.
Spending
Aviation spending not yet sourced.
History
| Year | Recruiting | Total revenue | Total athletics |
|---|---|---|---|
| 2025 | $4.41M | $205.28M | $195.93M |
| 2024 | $3.05M | $193.42M | $182.49M |
| 2023 | $3.37M | $192.66M | $183.65M |
| 2022 | $2.71M | $174.57M | $146.65M |