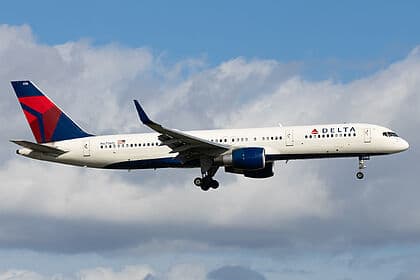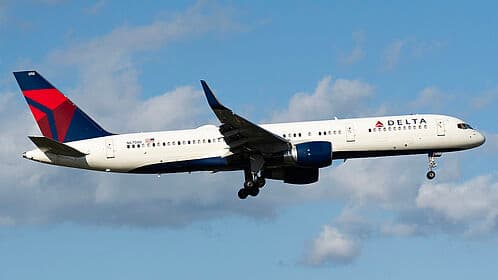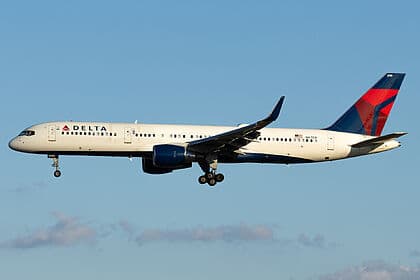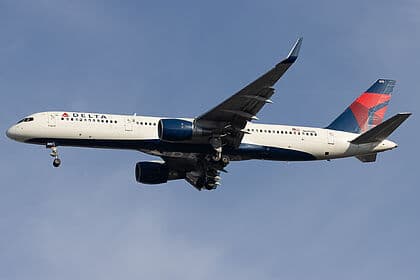
Florida Gators
Routes
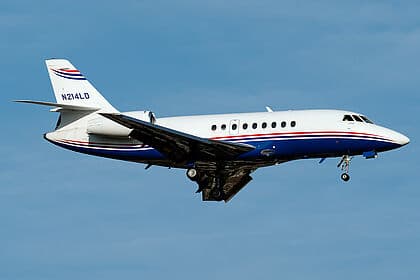
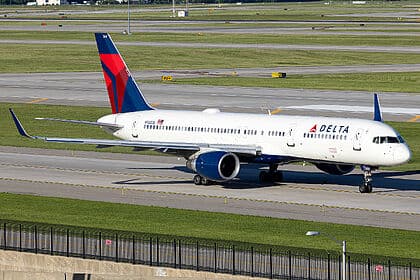
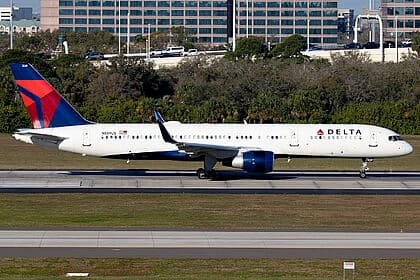
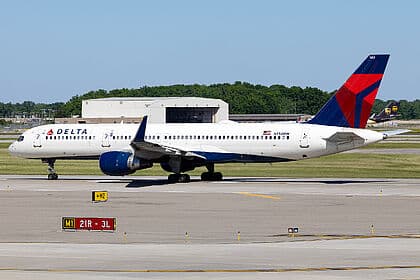
Aircraft · 4
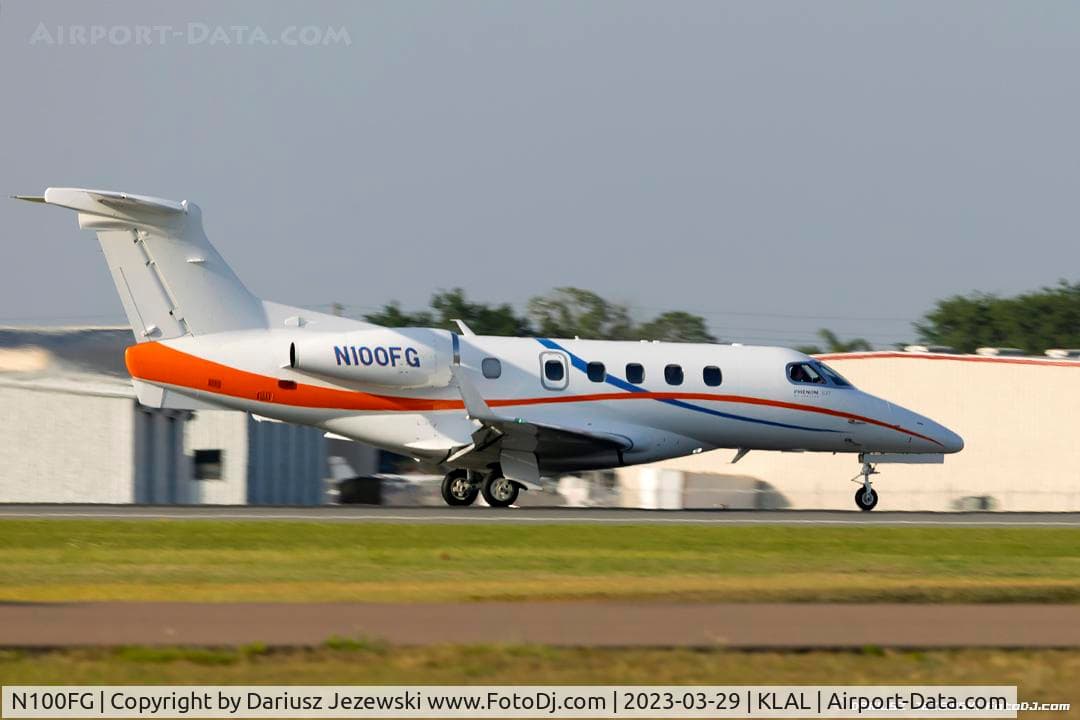
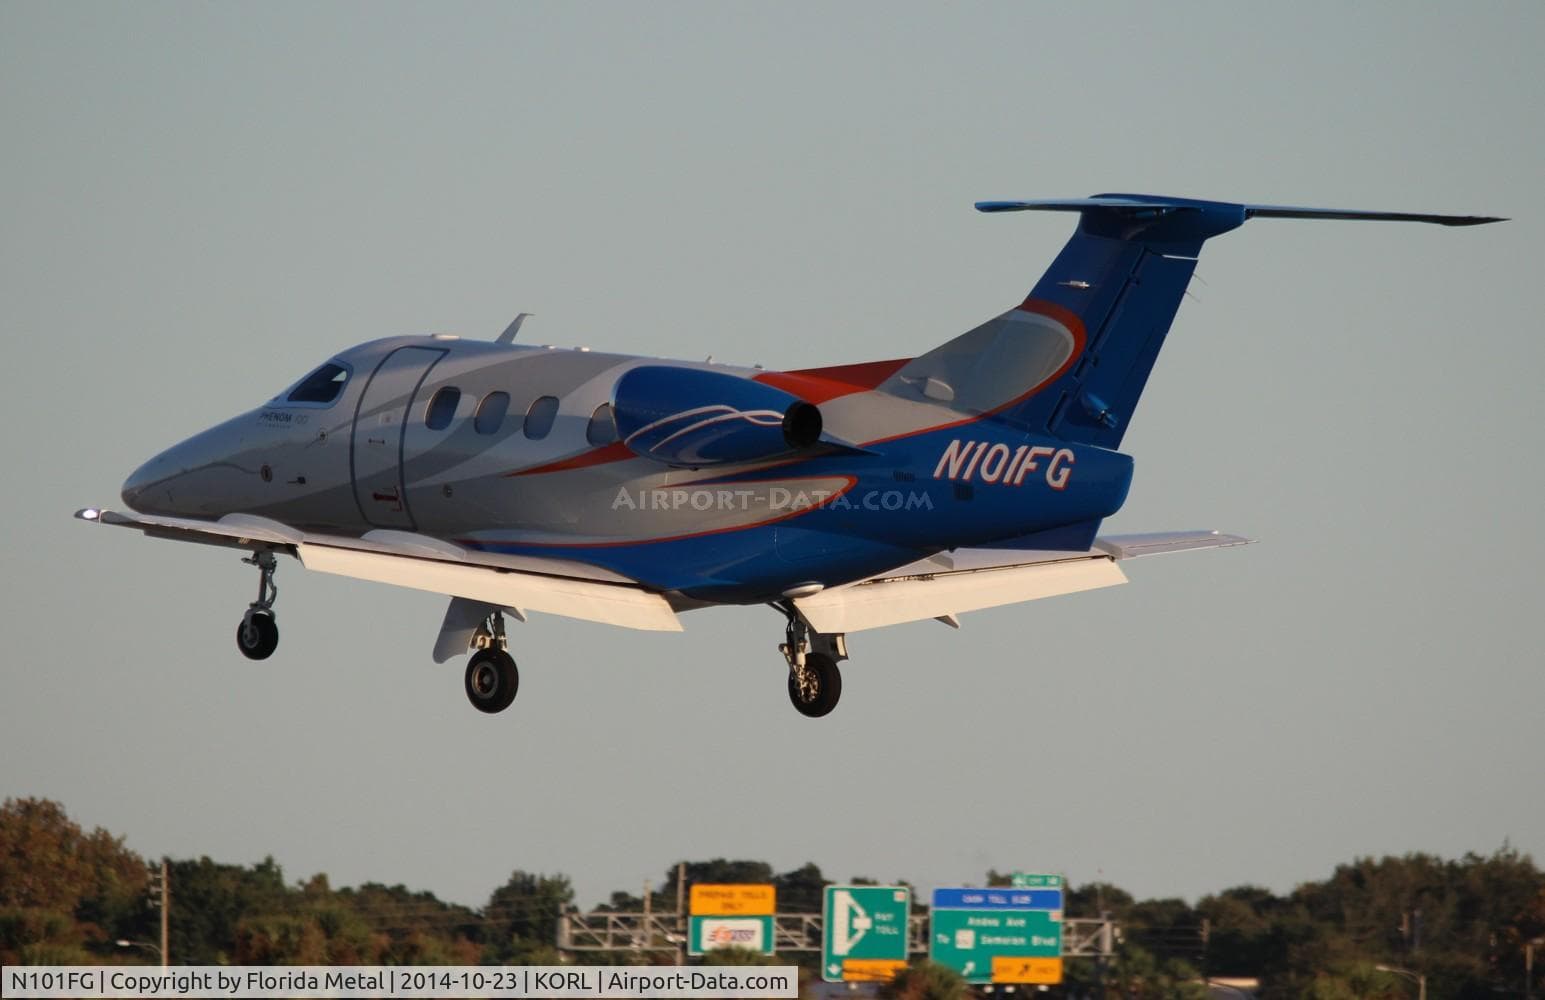
Booster & state-use · 2

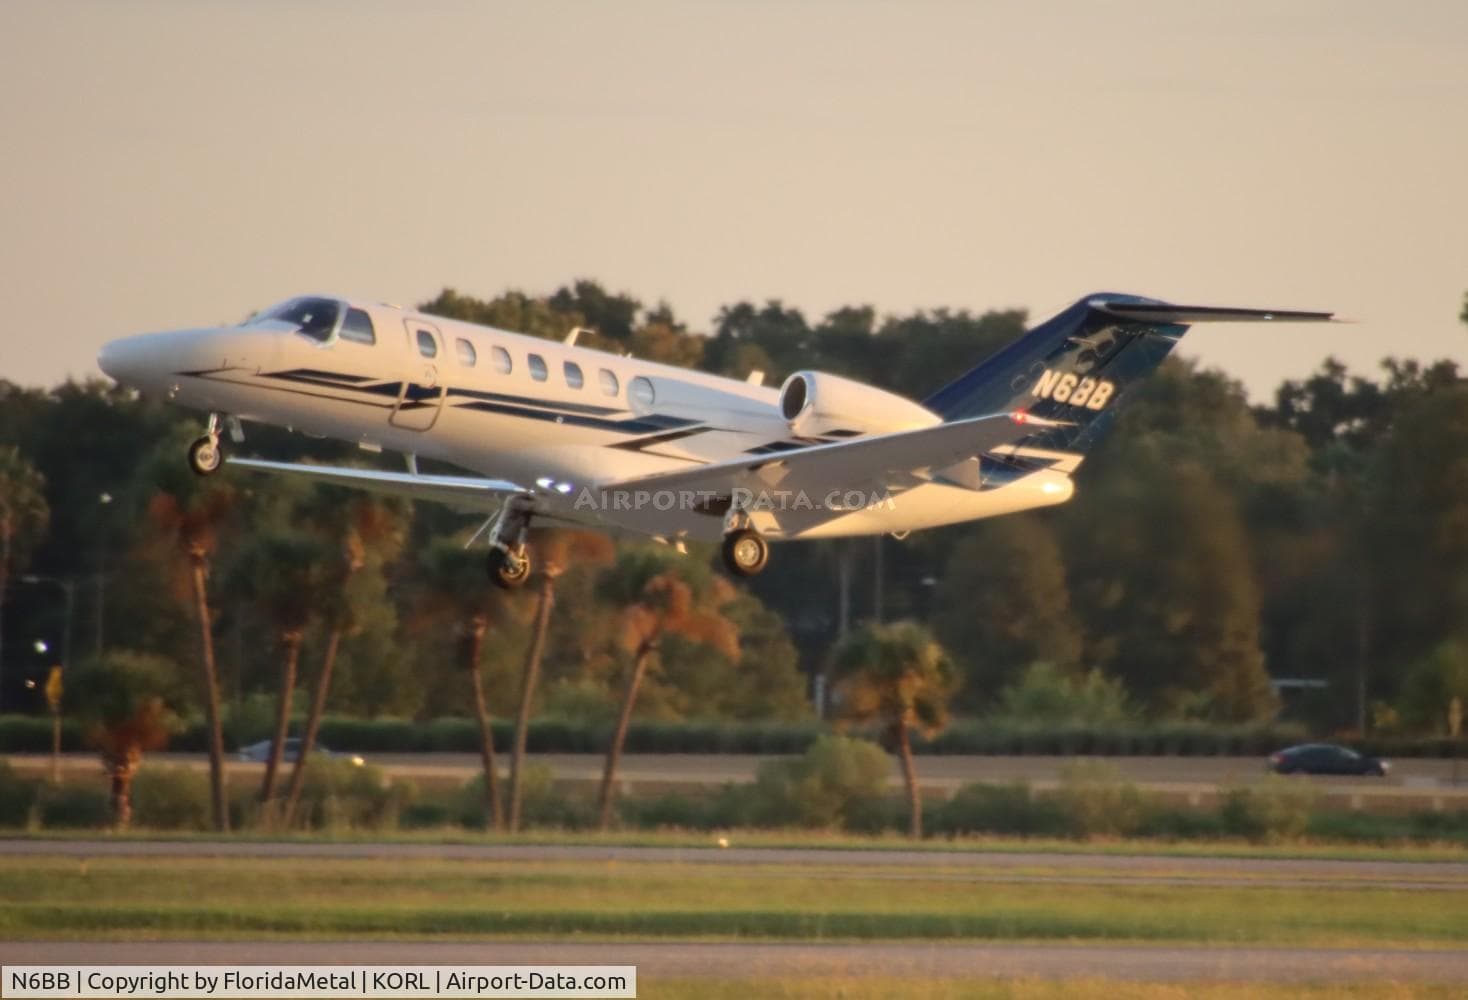
Documented aircraft · 15 cases
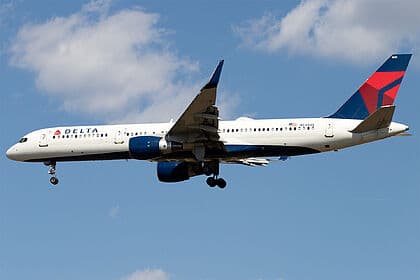
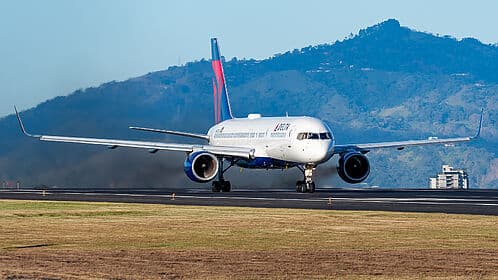
Flight activity
That's the last 7 days of Florida Gators flights. The full history is a Jump Seat · $15/month.
How the cost figures are estimated
Dollar figures on these rows are modeled from block hours and an effective-dated hourly rate, fit against an invoice corpus of 458 priced flight records worth $4.16M. A figure tagged Documented cost is a real invoice or billing record, not a model output. Booster-aircraft rows show an estimated value of the flight — gift-in-kind context, not program spending — and are excluded from the headline total. Some trips here are attributed through the current-owner directory rather than the aircraft's relationship on the flight date; treat those as provisional.
Rate version 2026-08-10.component-index-v1+type-utilization-v3. Full sources, the out-of-sample error measurement, and what these numbers do not claim: flight cost methodology.
Attribution methodology
Aircraft attribution does not identify passengers. Program-owned and verified privacy-alias aircraft show all tracked activity; other aircraft appear only when the trip is documented.
Spending
- TravelForm 990
- $15,433,165
- Recruiting · all sportsEADA
- $4.40M
- Total revenueEADA
- $199.24M
- Total athleticsEADA
- $199.24M
Scope
All-athletics travel · not aviation-only. The travel category measures the athletics association's broad travel spend, not individual aircraft, routes, or purposes.
History
| Year | Travel | Recruiting | Total revenue | Total athletics |
|---|---|---|---|---|
| 2025 | $15.43M | $4.40M | $199.24M | $199.24M |
| 2024 | $14.16M | $4.51M | $180.56M | $180.56M |
| 2023 | $15.35M | $4.56M | $176.80M | $176.80M |
| 2022 | $11.56M | $2.97M | $177.97M | $177.97M |
| 2021 | $7.68M | — | — | — |